The Carbon Footprint Of Mahjong
Players are assembling in Paris this weekend for TNT’s “7th Detonation” tournament; the last opportunity for many people to secure a direct invitation to WRC 2020 outside of regional quota allocations. (Australia’s open tournament in December marks the last qualifier on the books for everyone.) I don’t mean to cast a cloud over the event, but I do wonder at the environmental cost of tournaments. What kind of carbon footprint are we creating by traveling in pursuit of mahjong?
What Is A Carbon Footprint?
Carbon footprint is the term used for the amount of carbon dioxide and other carbon compounds created through the burning of fossil fuels—the kind of fuels consumed regularly when travelling by plane, train, or automobile. The definition is actually much broader and includes how much we consume, waste, and recycle. There are a vast number of factors that figure into one person’s carbon footprint, but I’m going to narrow it down and just look at some figures relative to travel.
Last year National Geographic published this info-graphic article comparing the impact of various modes of transportation available to make the same trip. The takeaway from this is that electric car is the most carbon efficient way of moving people from one place to another, excluding biking and walking. I am going to focus on the most carbon intensive mode of travel, flight, and use this weekend’s Paris open as a model.
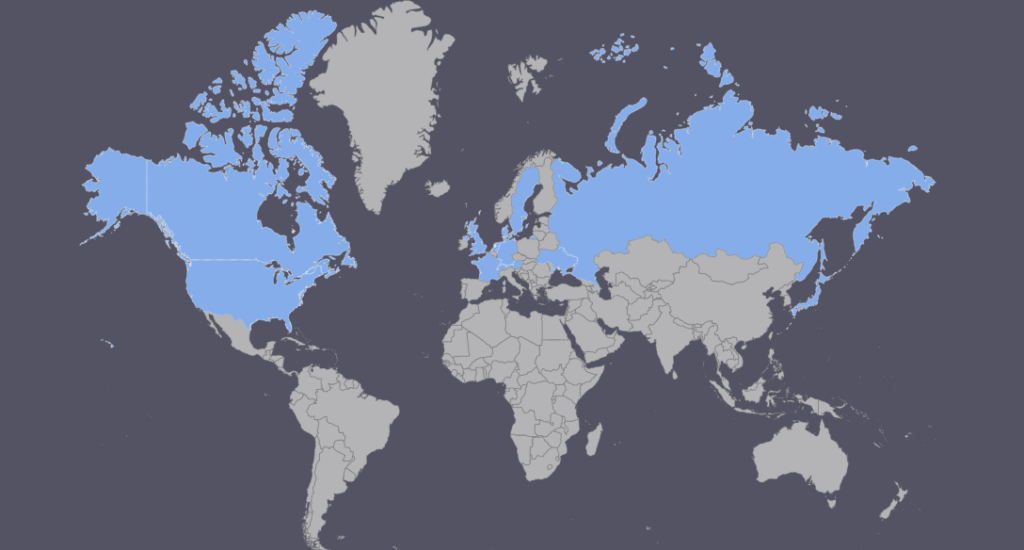
TNT has 56 registered players listed. The vast majority of them are from the European continent, with a handful from the United States and Canada. And let us not forget the special guest pros attending from Japan. A plotted map looks like this.

For the sake of this article, I can pass on France and the countries on the same landmass that are generally adjacent to it. Other modes of transportation are available that are more likely than air travel. That leaves the United Kingdom, Sweden, Ukraine, Russia, Japan, United States, and Canada. (If you are using more efficient modes of transport from these countries, you get a gold star!)
Using a carbon offset calculator provided by the International Civil Aviation Organization, I can break out the estimated emissions per traveler (round trip) from these countries. For each country I am estimating the most likely international airport(s) or capital city as the origin, and the output is expressed in kg of carbon emissions
- United Kingdom: 113 kg
- Sweden: 293 kg
- Ukraine: 356 kg
- Russia: 399 – 411 kg
- Japan: 846 kg
- United States: 649 – 956 kg
- Canada: 629 kg
What Does A Kilogram of Carbon Emissions Look Like?
To put these figures in context, 1 kilogram of carbon is roughly equivalent to 128 charges on a smartphone, 2.5 miles driven in a passenger vehicle, or just burning one pound of coal.
There a a lot of things a person can do to reduce their carbon footprint. While it doesn’t look like travel is going away anytime soon, there are ways to offset one’s footprint to minimize the environmental impact when you do.
